Green House Gases Emission Performance
| S.NO | Particulars | CY 2020 | CY 2021 | CY 2022 |
| 1 | Total GHG Emissions Projected in tons of Co2E | 49307 | 54887 | 49407 |
| 2 | Actual GHG Emissions in tons of CO2E | 49307 | 54020 | 47275 |
| 3 | % Of reduction | 0% | 2% | 4% |
ENERGY & GHG Reduction INITIATIVES TAKEN CY 2022
| S.No | Description | % Of Savings | CO2 Reduction in Tons |
| 1 | Process Ambiance Alteration | 2.3% | 1089 |
| 2 | LED Lights usage | 0.2% | 92 |
| 3 | Motion Sensors | 0.2% | 96 |
| 4 | Optimization of office lights | ||
| 5 | Streetlights Optimization | ||
| Total | 2.7% | 1276 | |
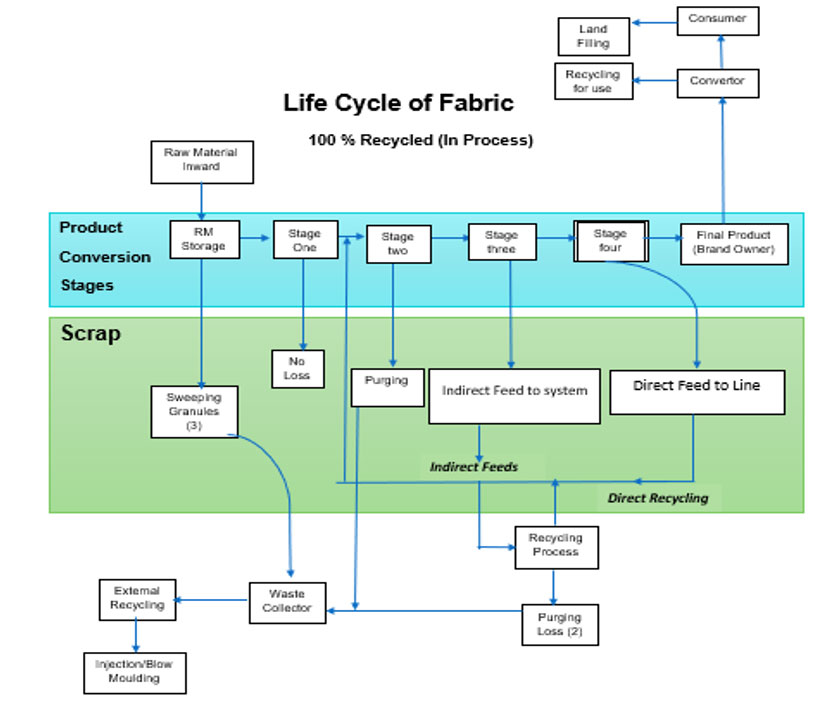
Material Sustainability
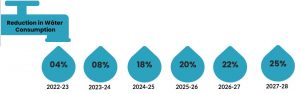
Water Consumption Targets of GN
| S.NO | Water Consumption in KL | CY 2020 |
CY 2021 |
CY 2022 |
CY 2023 |
CY 2024 |
CY 2025 |
CY 2026 |
CY 2027 |
CY 2028 |
| 1 | Water savings in KL by various methods (Adopting latest technolgy, Process Modifications etc.) | 0 | 0 | 0 | 1282 | 2565 | 5565 | 6065 | 8065 | 9165 |
| 2 | % Of reduction in Raw Water Intake | 0% | 0% | 0% | 4% | 8% | 18% | 20% | 22% | 25% |
| 3 | Discharge to the Environment | 0 | 0 | 0 | 0 | 0 | 0 | 0 | 0 | 0 |
GHG Metric Targets of Global Nonwovens
| S.NO | Particulars | CY 2020 | CY 2021 | CY 2022 | CY 2023 | CY 2024 | CY 2025 | CY 2026 | CY 2027 | CY 2028 | CY 2029 | CY 2030 | CY 2040 | CY 2050 |
| 1 | Total GHG Emissions Projected in tons of Co2E | 49307 | 54887 | 49407 | 121566 | 121566 | 121566 | 121566 | 142720 | 142720 | 168087 | 168087 | 168087 | 168087 |
| 2 | Targeted GHG Emissions in tons of CO2E | 49307 | 54020 | 47275 | 118048 | 117872 | 114485 | 114291 | 130171 | 129957 | 154032 | 133780 | 94637 | 0 |
| 3 | % Of reduction | 0% | 2% | 4% | 3% | 3% | 6% | 6% | 9% | 9% | 8% | 20% | 44% | 100% |
| 4 | Renewable energy in MW-Installation Roof top Solar plant | 0.0 | 0.0 | 0.0 | 0.0 | 0.0 | 2.4 | 2.4 | 3.2 | 3.2 | 4.0 | 4.0 | 4.0 | 4.0 |
| 5 | Renewable energy in MW-Installation Ground mount Solar plant | 0.0 | 0.0 | 0.0 | 0.0 | 0.0 | 0.0 | 0.0 | 3.0 | 3.0 | 3.0 | 6.0 | 9.0 | 20.5 |
| 6 | Renewable energy in MW-Installation of Wind Power plant | 0.0 | 0.0 | 0.0 | 0.0 | 0.0 | 0.0 | 0.0 | 0.0 | 0.0 | 0.0 | 10.0 | 30.0 | 77.0 |